EcoSolve Dashboard
React, Data Visualization, Environmental APIs
Environmental monitoring and sustainability tracking dashboard designed to help organizations visualize and manage their ecological impact through real-time data analytics.
Write-ups about projects I've built and things I'm currently working on. For all these projects, I was responsible for the bulk of the interactive data visualisation developmemt.
Environmental monitoring and sustainability tracking dashboard designed to help organizations visualize and manage their ecological impact through real-time data analytics.
Comprehensive data analysis examining the impact of Trump administration policies on USAID programs in Southeast Asia, featuring interactive visualizations of funding changes and regional effects.
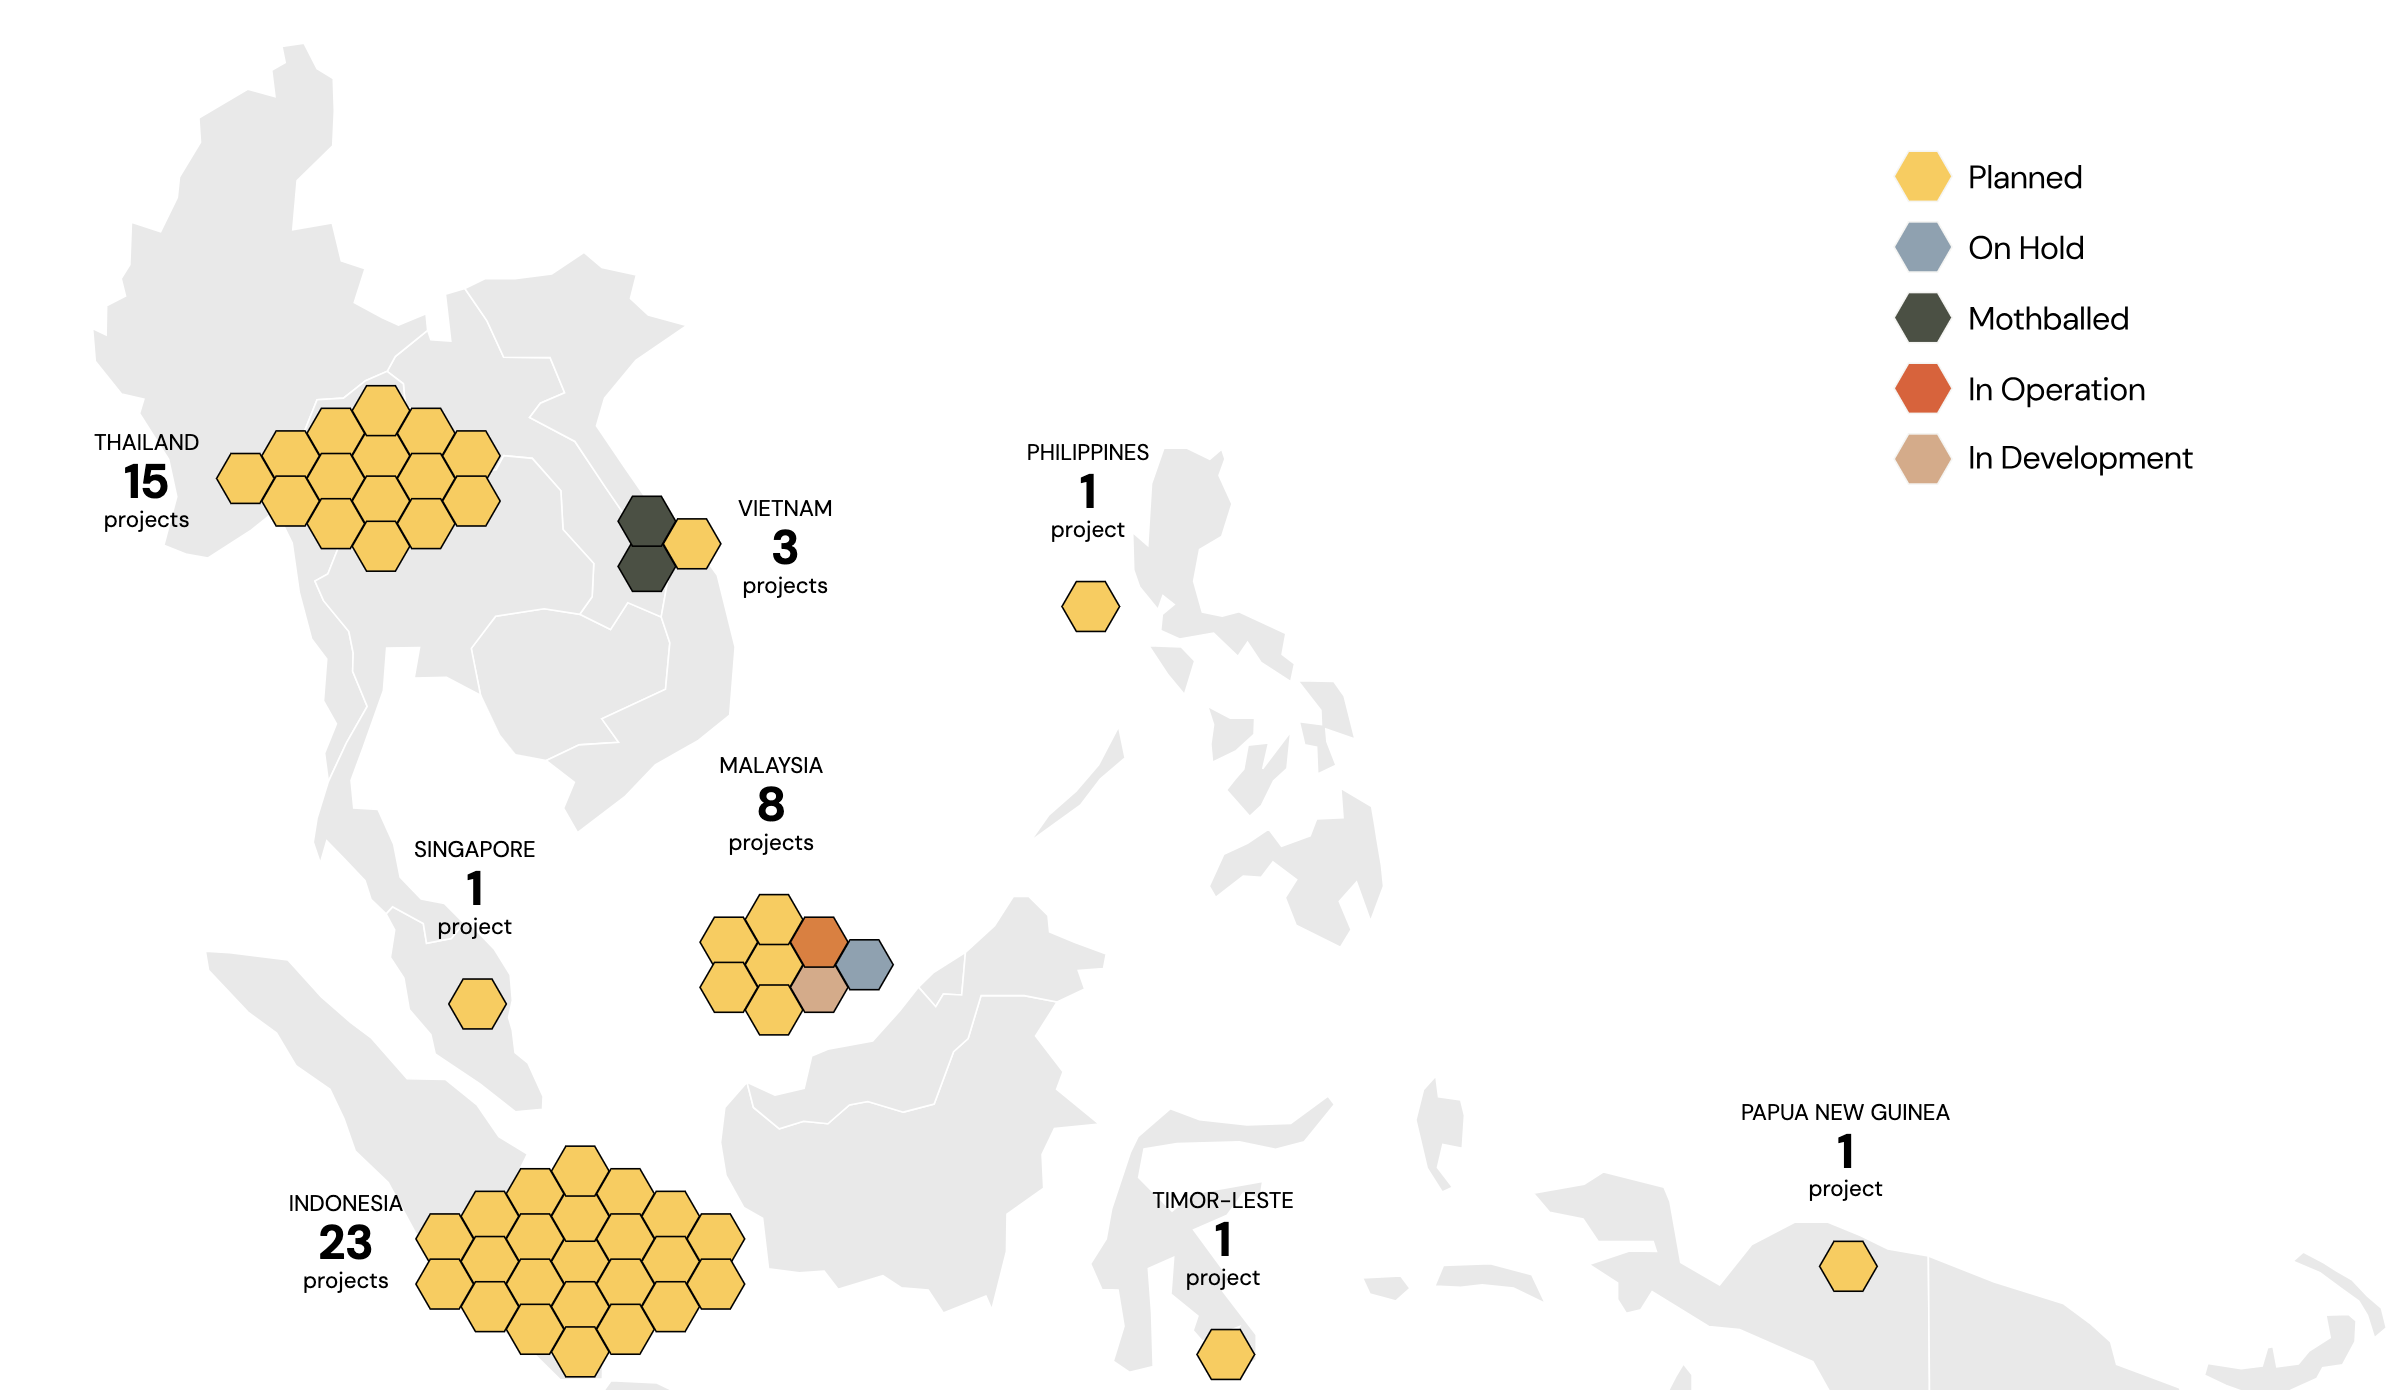
Interactive data visualization exploring carbon capture technologies and their potential to help Asia reach climate goals. Features comprehensive analysis of regional implementation challenges and opportunities.
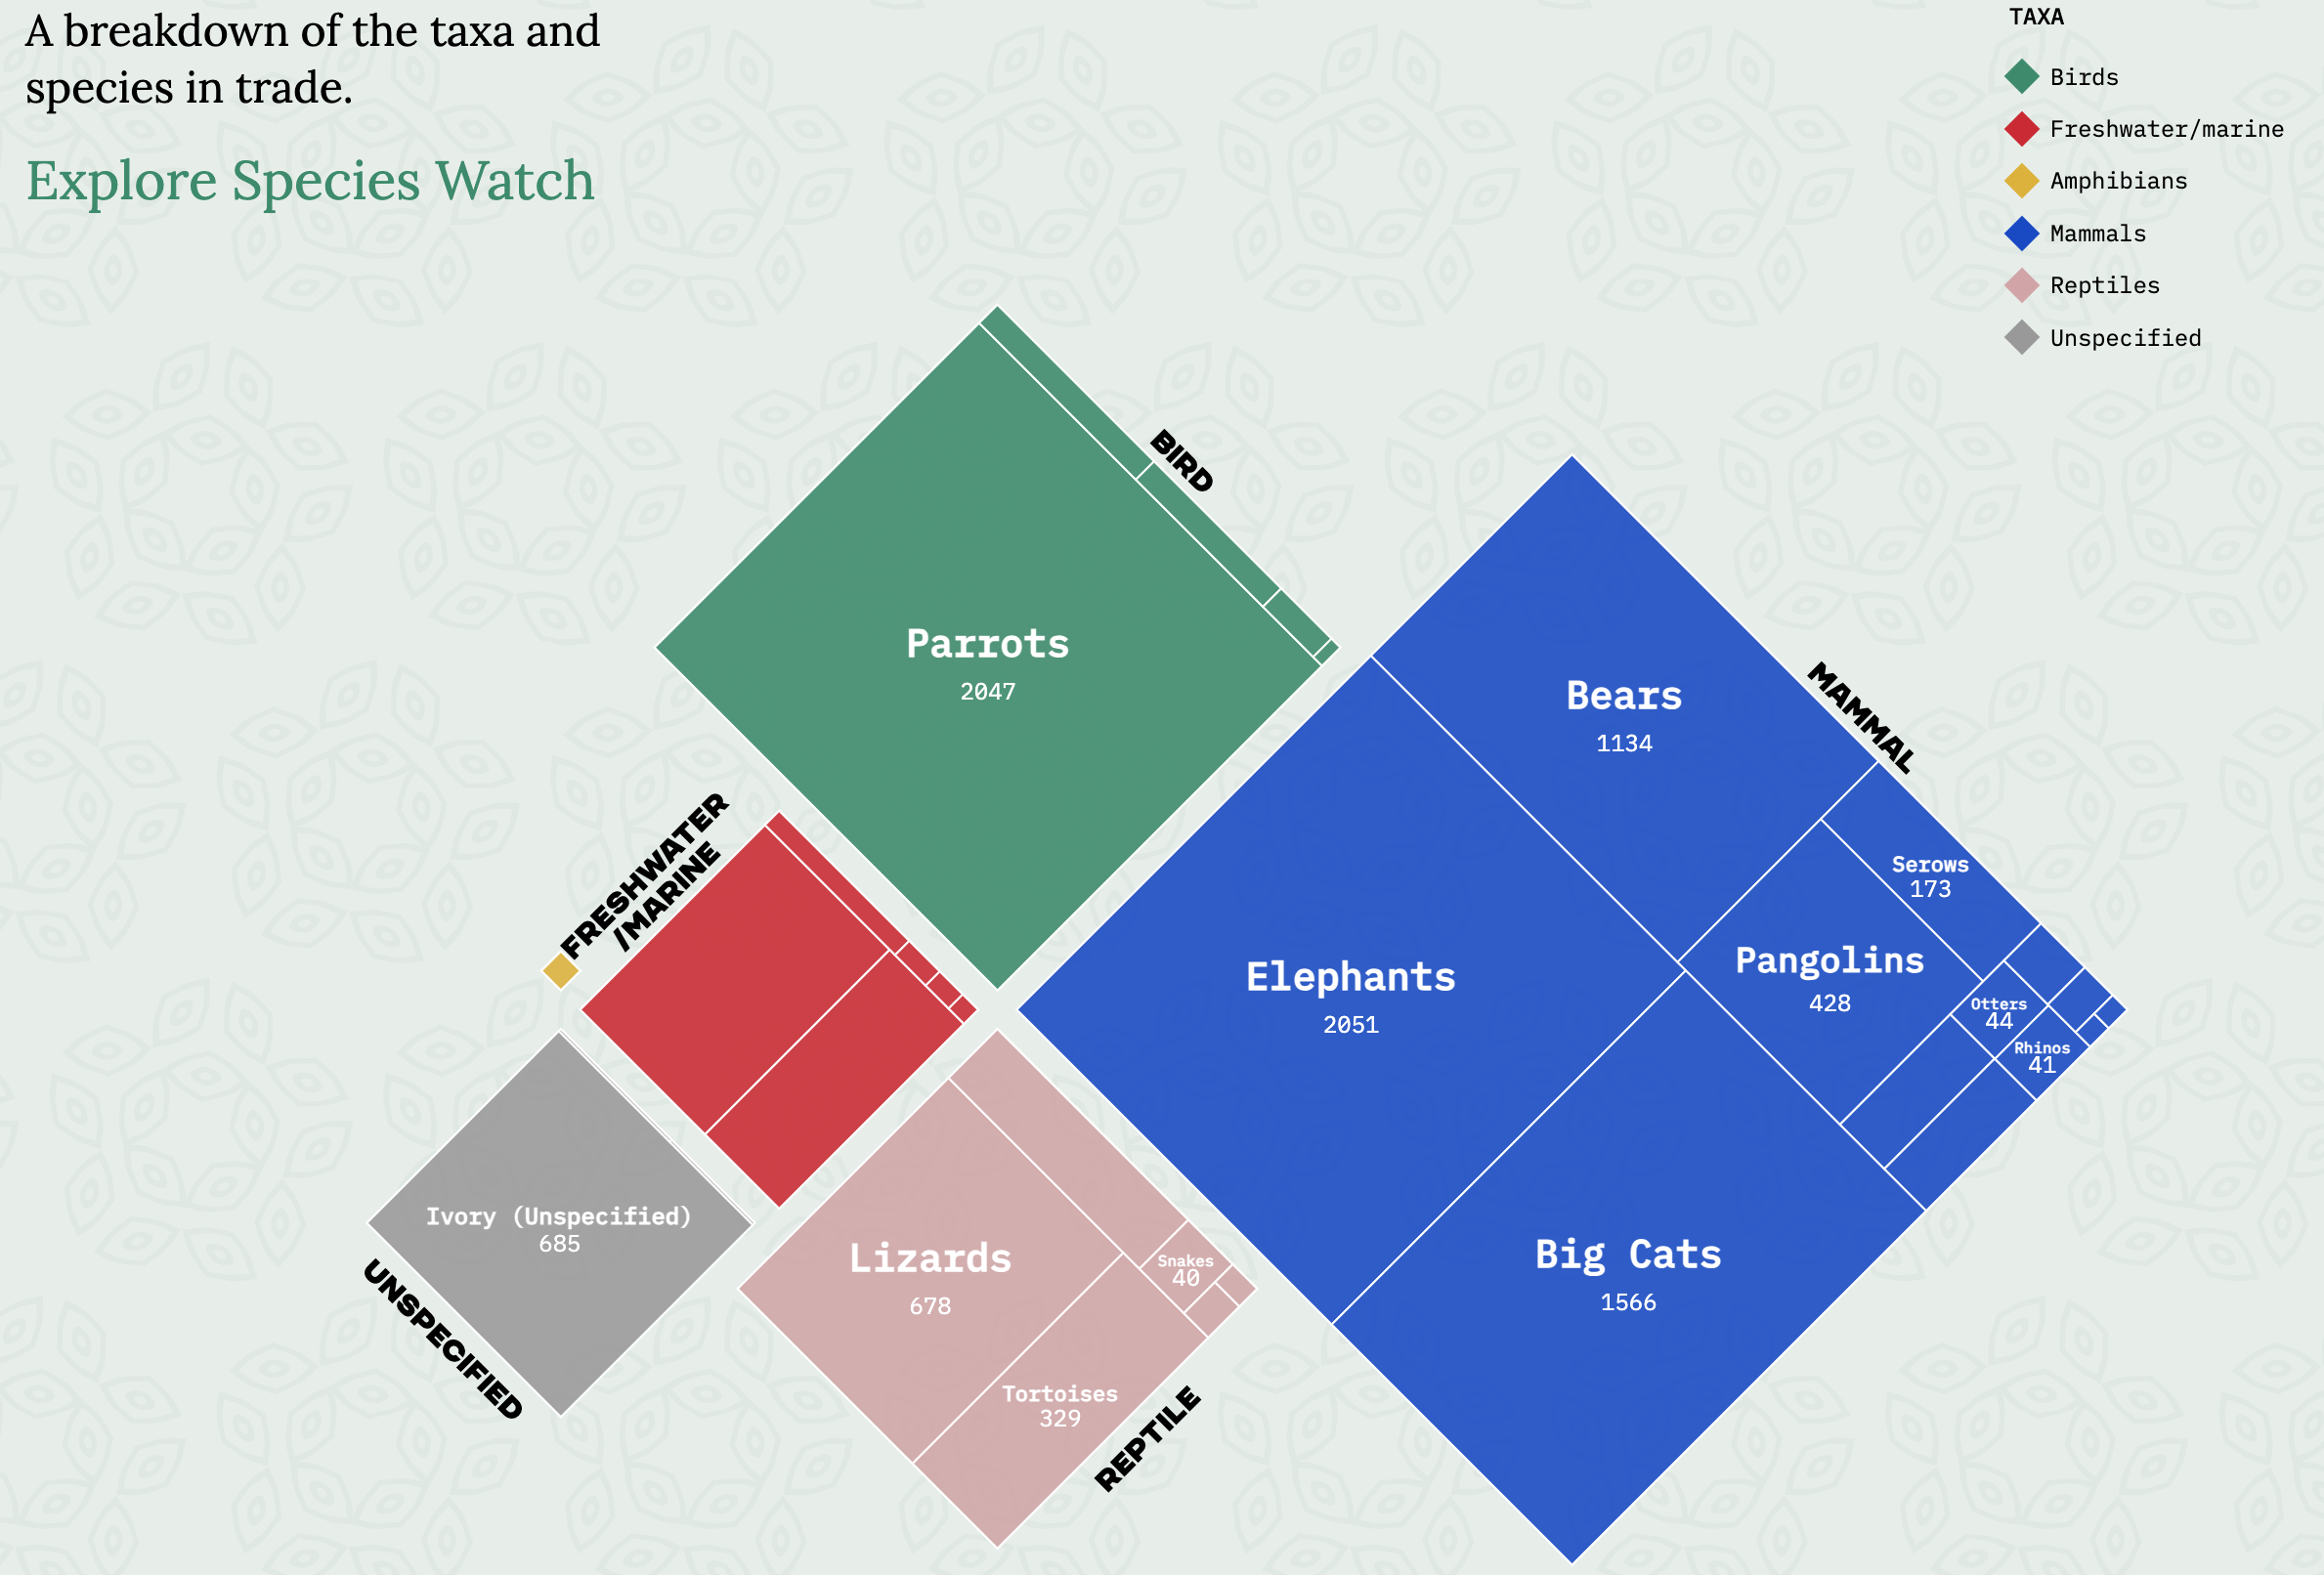
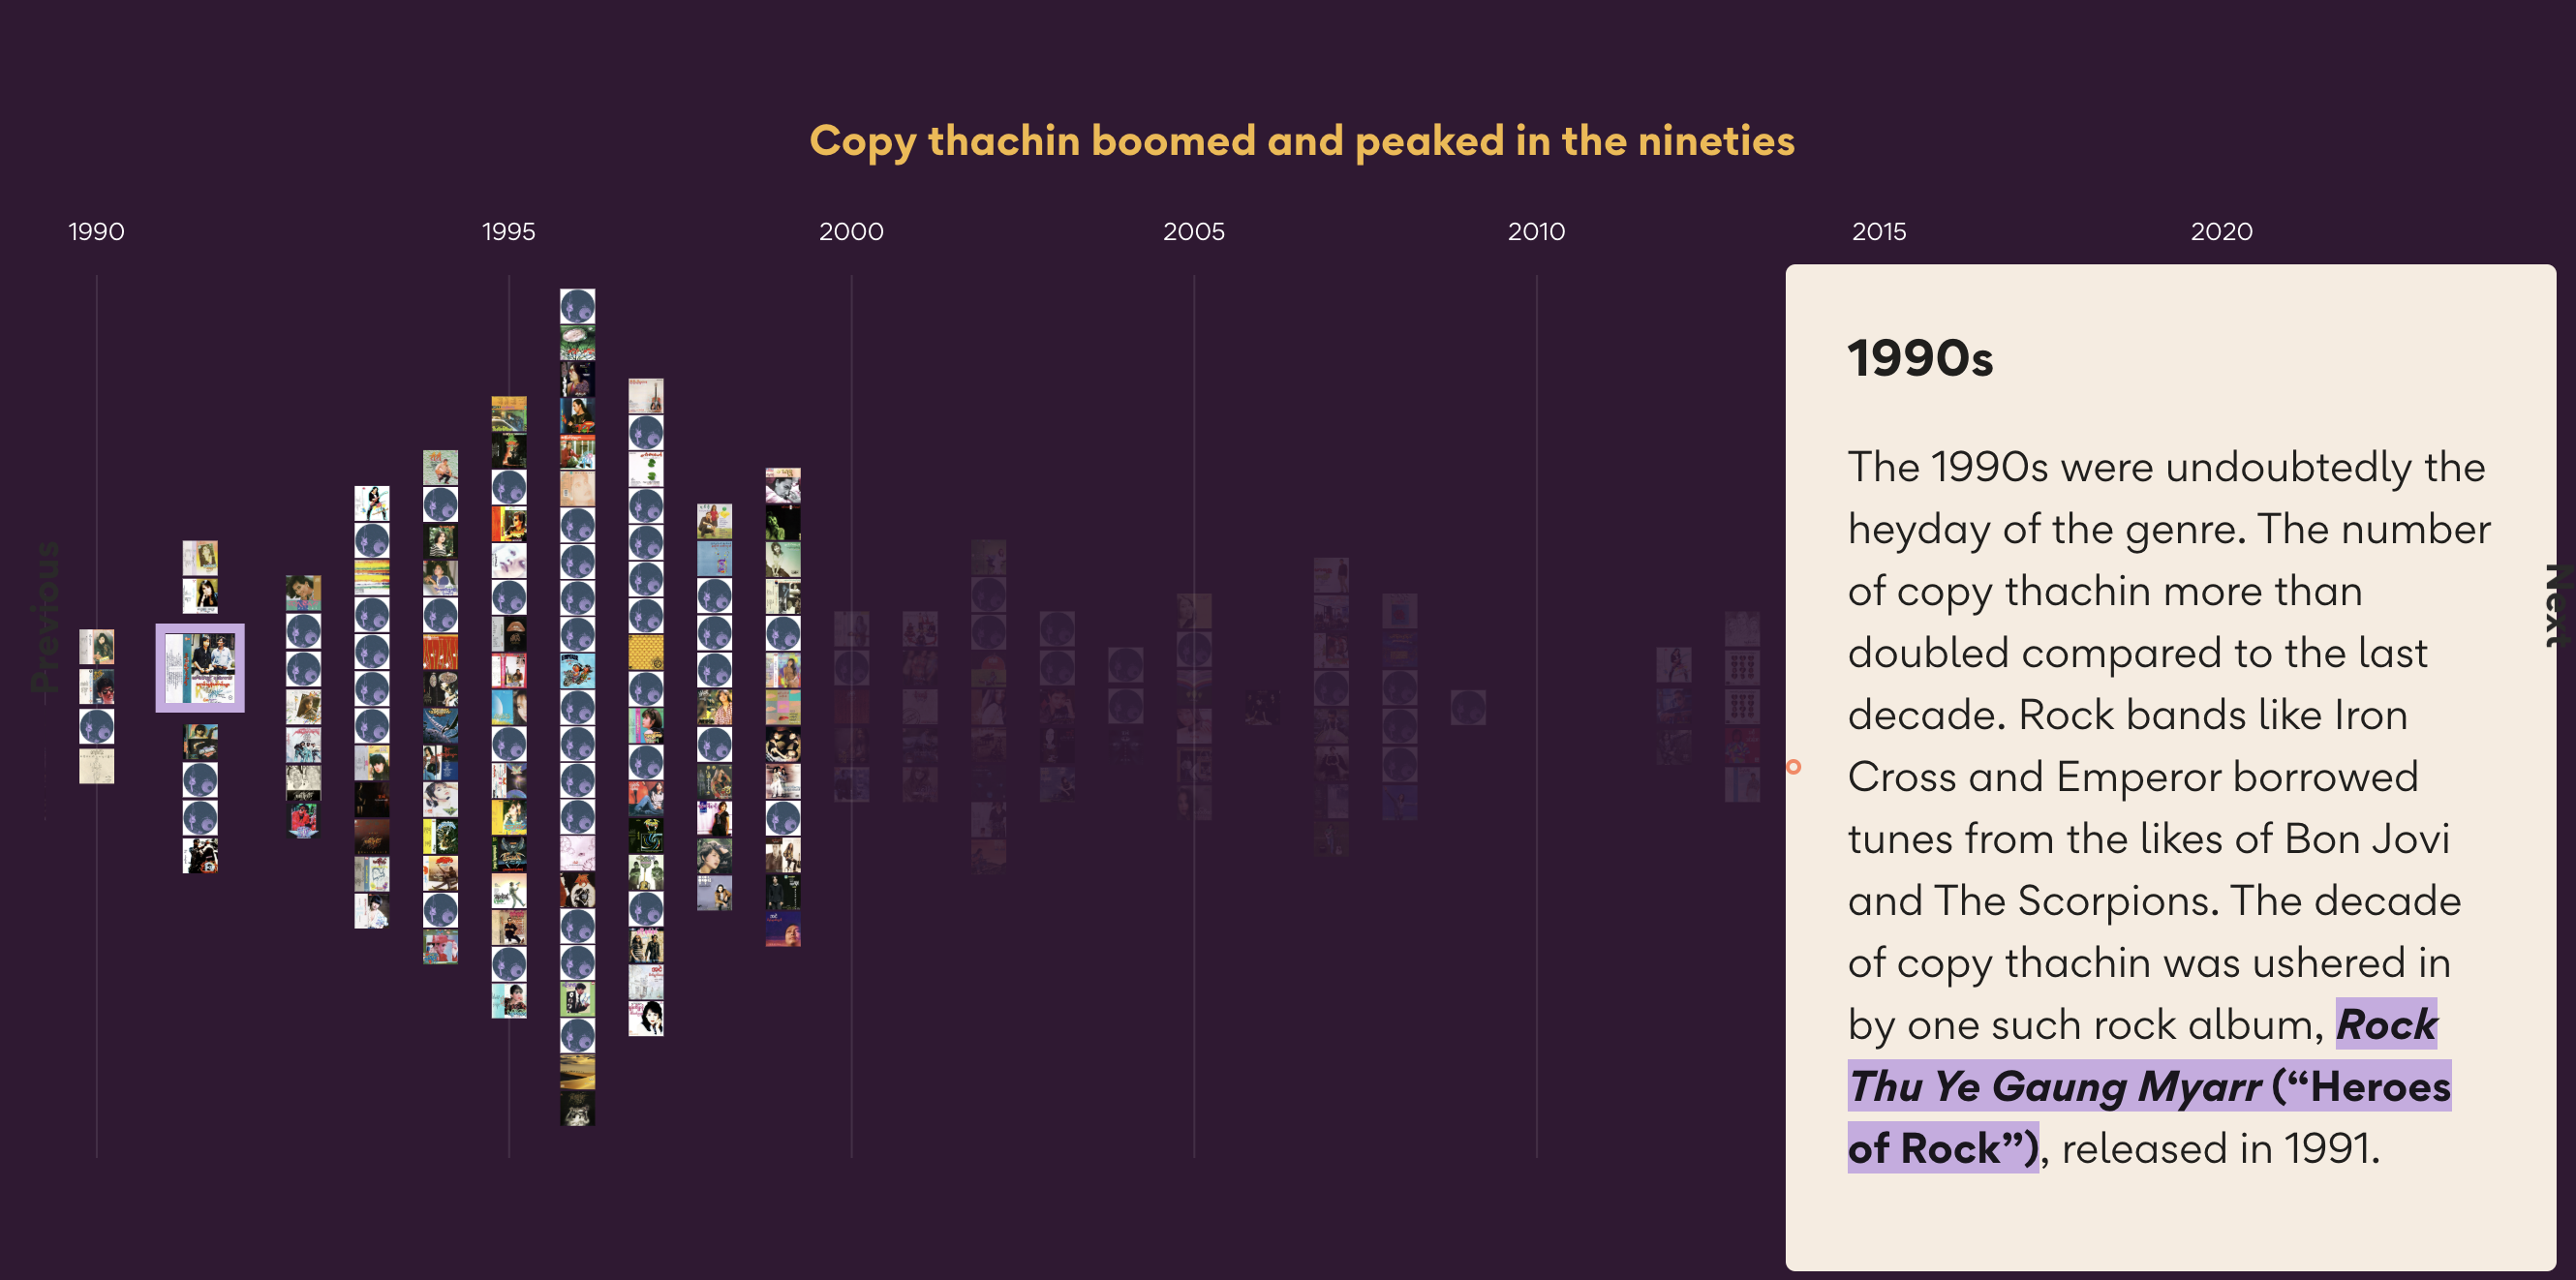
Data-driven storytelling project exploring Myanmar's music industry through the lens of copy songs. Features interactive visualizations and cultural analysis of musical trends and copyright issues.
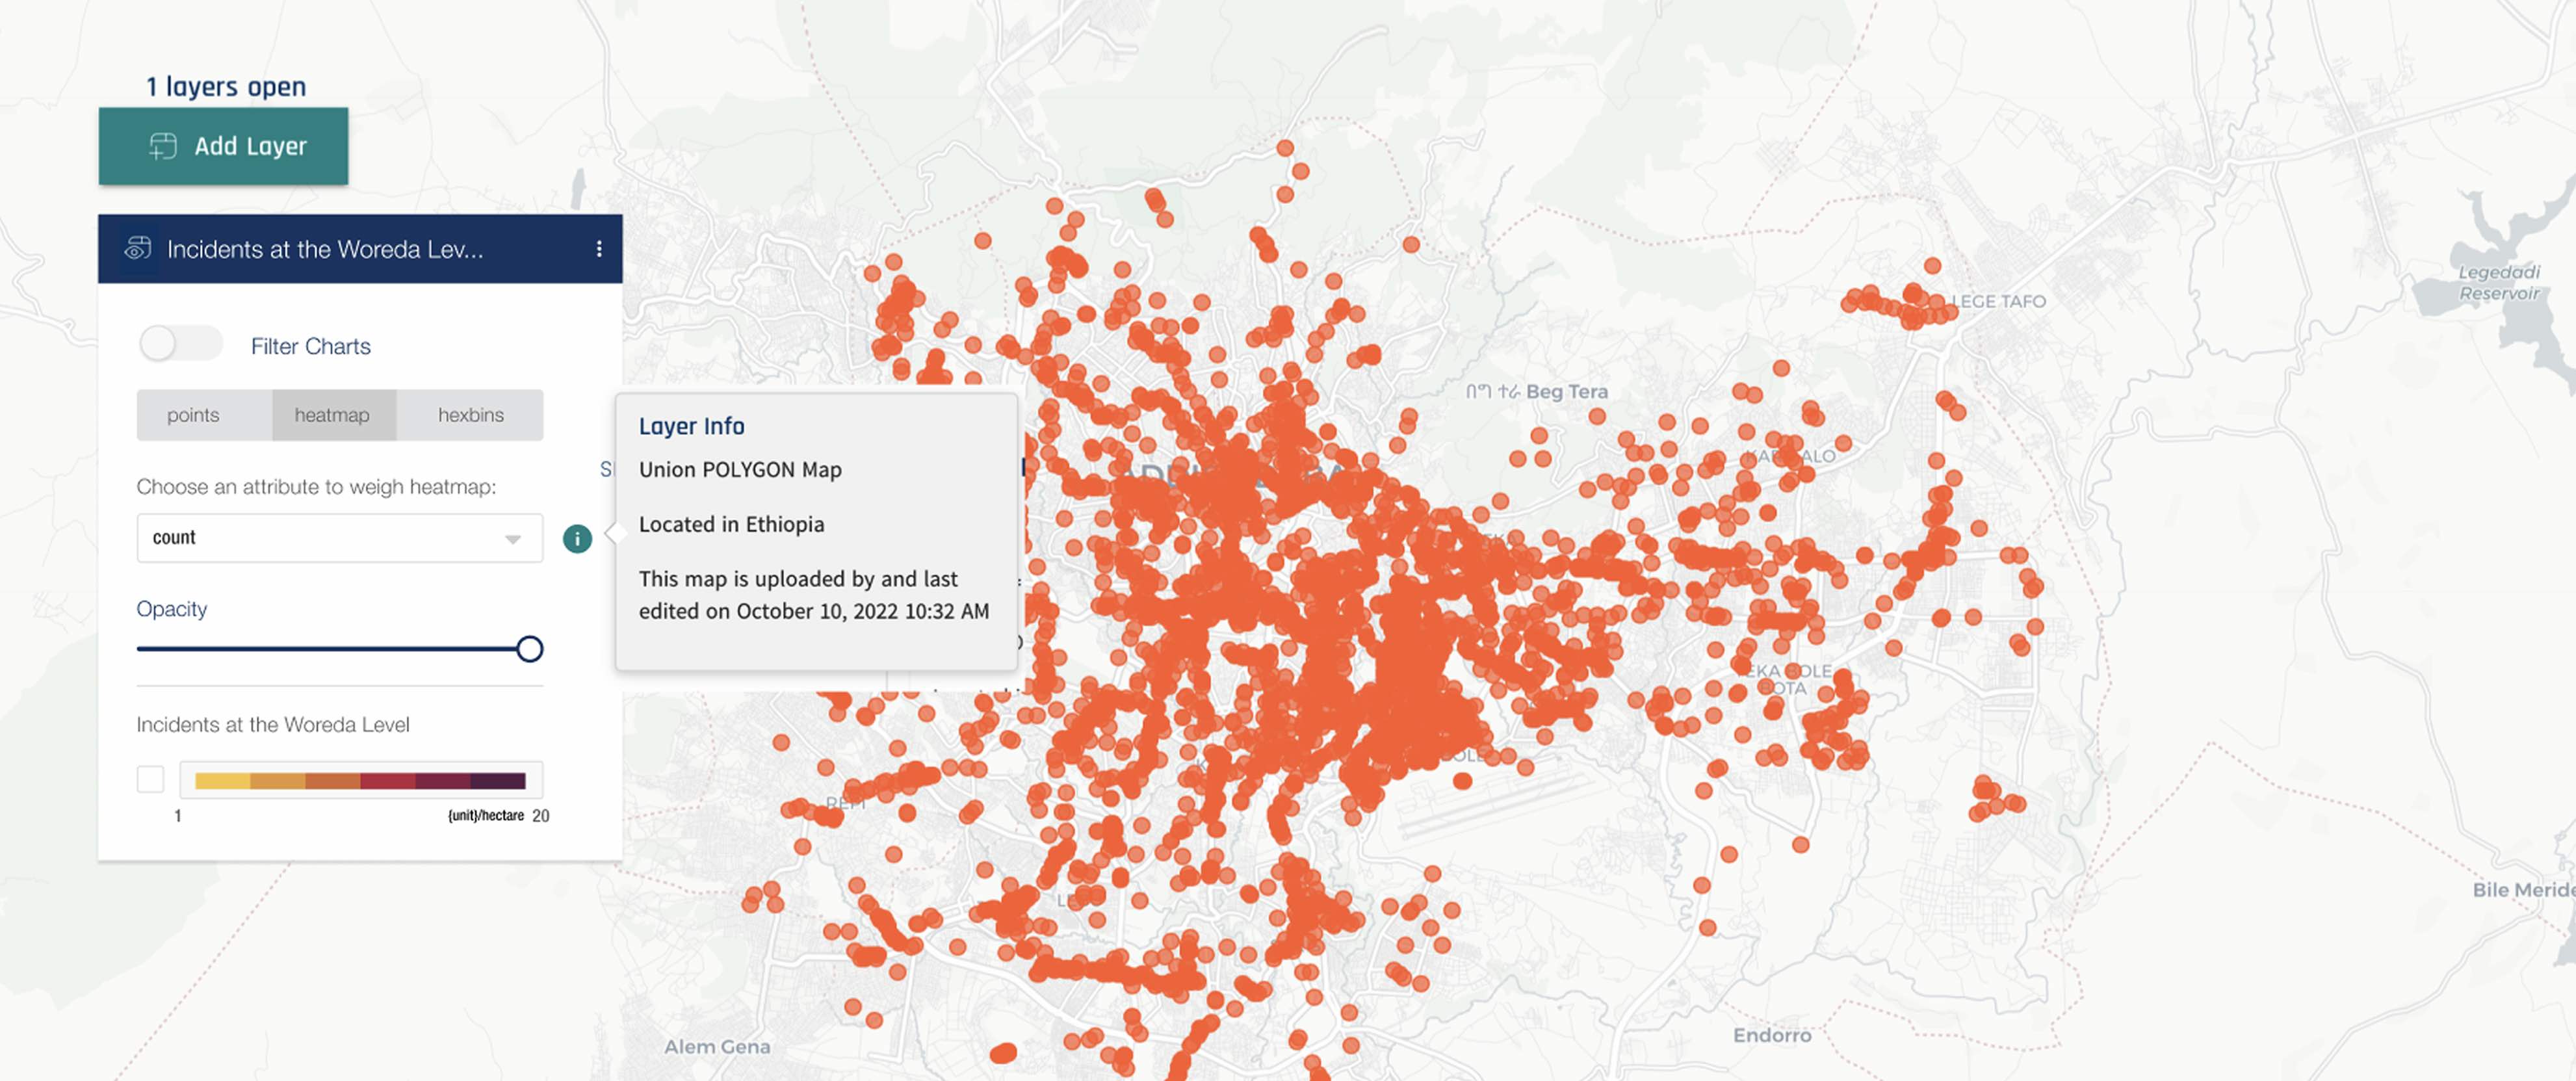
A collaborative GIS portal enabling local government officials to upload, clean, share, and analyze cross-departmental datasets. Features data editor and visualizer with permission settings and audit trails.